Data Carpentry for Pharmacists
Teaching the tools to get computers to do cool science

The high-resolution images from Canopy Height from Space
can be integrated with satellite imagery that is gathered more frequently. We
will use data collected from MODIS. One common
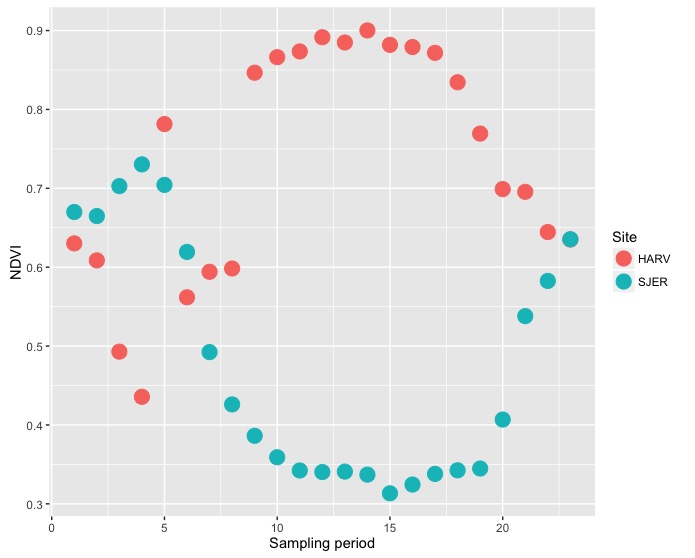
ecological process that can be observed from space is phenology
(or seasonal patterns) of plants.
Multi-band satellite imagery can be processed to provide a vegetation index of greenness called NDVI.
NDVI values range from -1.0 to 1.0, where negative values indicate clouds,
snow, and water; bare soil returns values from 0.1 to 0.2; and green vegetation returns values greater than 0.3.
Download HARV_NDVI and SJER_NDVI and place them in a folder with the NEON airborne data. The zip contain folders with a year’s worth of NDVI sampling
from MODIS. The files are in order (and named) by date and can be organized
implicitly by sampling period for analysis.
cellStats()) for Harvard Forest and SJER
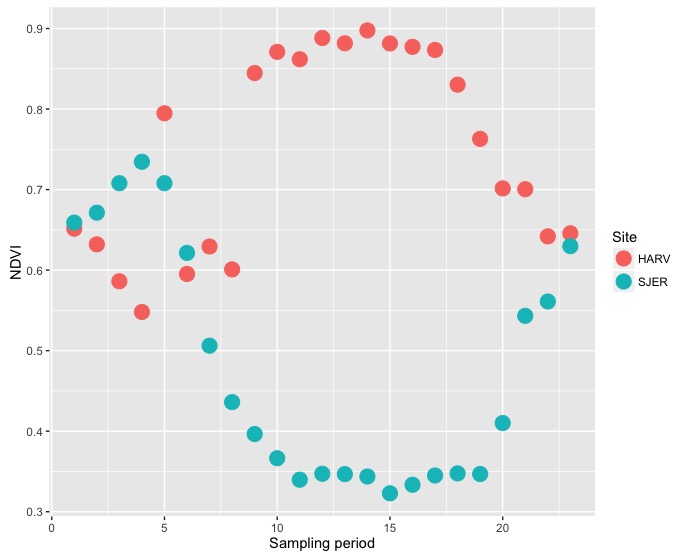
through time using different colors for the two sites.plot_locations (extract()) for Harvard Forest
and SJER through time using different colors for the two sites.chm) from
Canopy Height from Space
and seasonal phenology (NDVI) that you observe in this analysis in a
comment. Also, describe the impact of the different mean calculations on the
analysis.Optional challenge: Extract sampling_day from the NDVI file_name and
include that with your data.frame for graphing.